The effects of La Niña on the Niseko area
53% of the time, Niseko has out-performed it's
average snowfall during La Niña cycles
average snowfall during La Niña cycles
Conclusion:
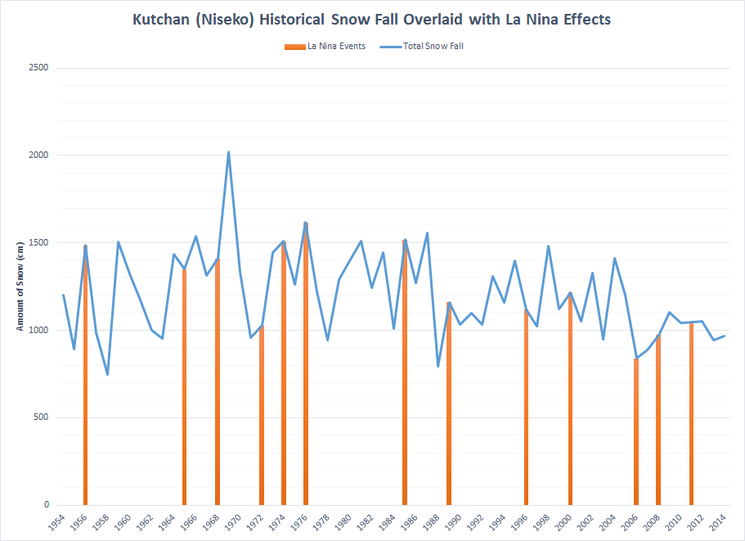
During the 13 La Niña cycles listed below, 6 years had snow fall below the average and 7 years had snow fall above the average, suggesting that La Niña cycle in Niseko is historically likely to produce barely-above-average snowfall conditions.
BUT don't start getting excited just yet; the 53% average is mostly being carried by numbers before 1989 (notice how the orange lines go up higher on the left side of the chart than the right). From 1989 and beyond, La Niña is mostly associated with below-average snowfall, which could indicate a change in long-term trends in the region.
Chart Analysis:
The blue line in the chart below denotes how much snowfall was recorded by the Japan Meteorological Agency (JMA) for the time span of 1953 to 2014 (years located on the X-axis). The intersecting orange bars indicate La Niña years recorded by JMA, specific to Japan.
Some La Niña years such as 1972, 2006 and 2012 show a decline in snowfall during La Niña period, other years such as 1956, 1976 and 1986 show a peak of snow fall during the weather system.
How does Niseko compare to other regions in Japan?
Some technical information:
The chart above shows historical snow fall data for the town of Kutchan, located 16 minutes from the Hirafu base of Niseko United. The elevation of Kutchan is just under 200m while the elevation of the Niseko resorts ranges from 320m to 1,200m; the difference in elevation means that Niseko will receive more snow, but that Kutchan is close enough to extrapolate general trends in the area.
The source of La Niña years can be found here, the source of historical snow fall data can be found here. The data provided by JMA is for Kutchan WMO Station ID:47433 Lat 42o54.0'N Lon 140o45.4'E


